What’s the best way to tell area residents about plans for a new asylum shelter nearby?
The government should tell communities directly about plans for new asylum shelters, some activists and politicians say.
Last year, we ran a series of maps showing how much you needed to earn to rent an affordable one-bedroom apartment in the city. We’ve updated them and, no surprise, renting’s become pricier.

Last year, we published a series of maps showing how much a person should have been earning per hour to be able to rent an affordable one-bedroom apartment in different parts of the city.
Now we’ve updated those maps, and, no surprise, renting’s become pricier.
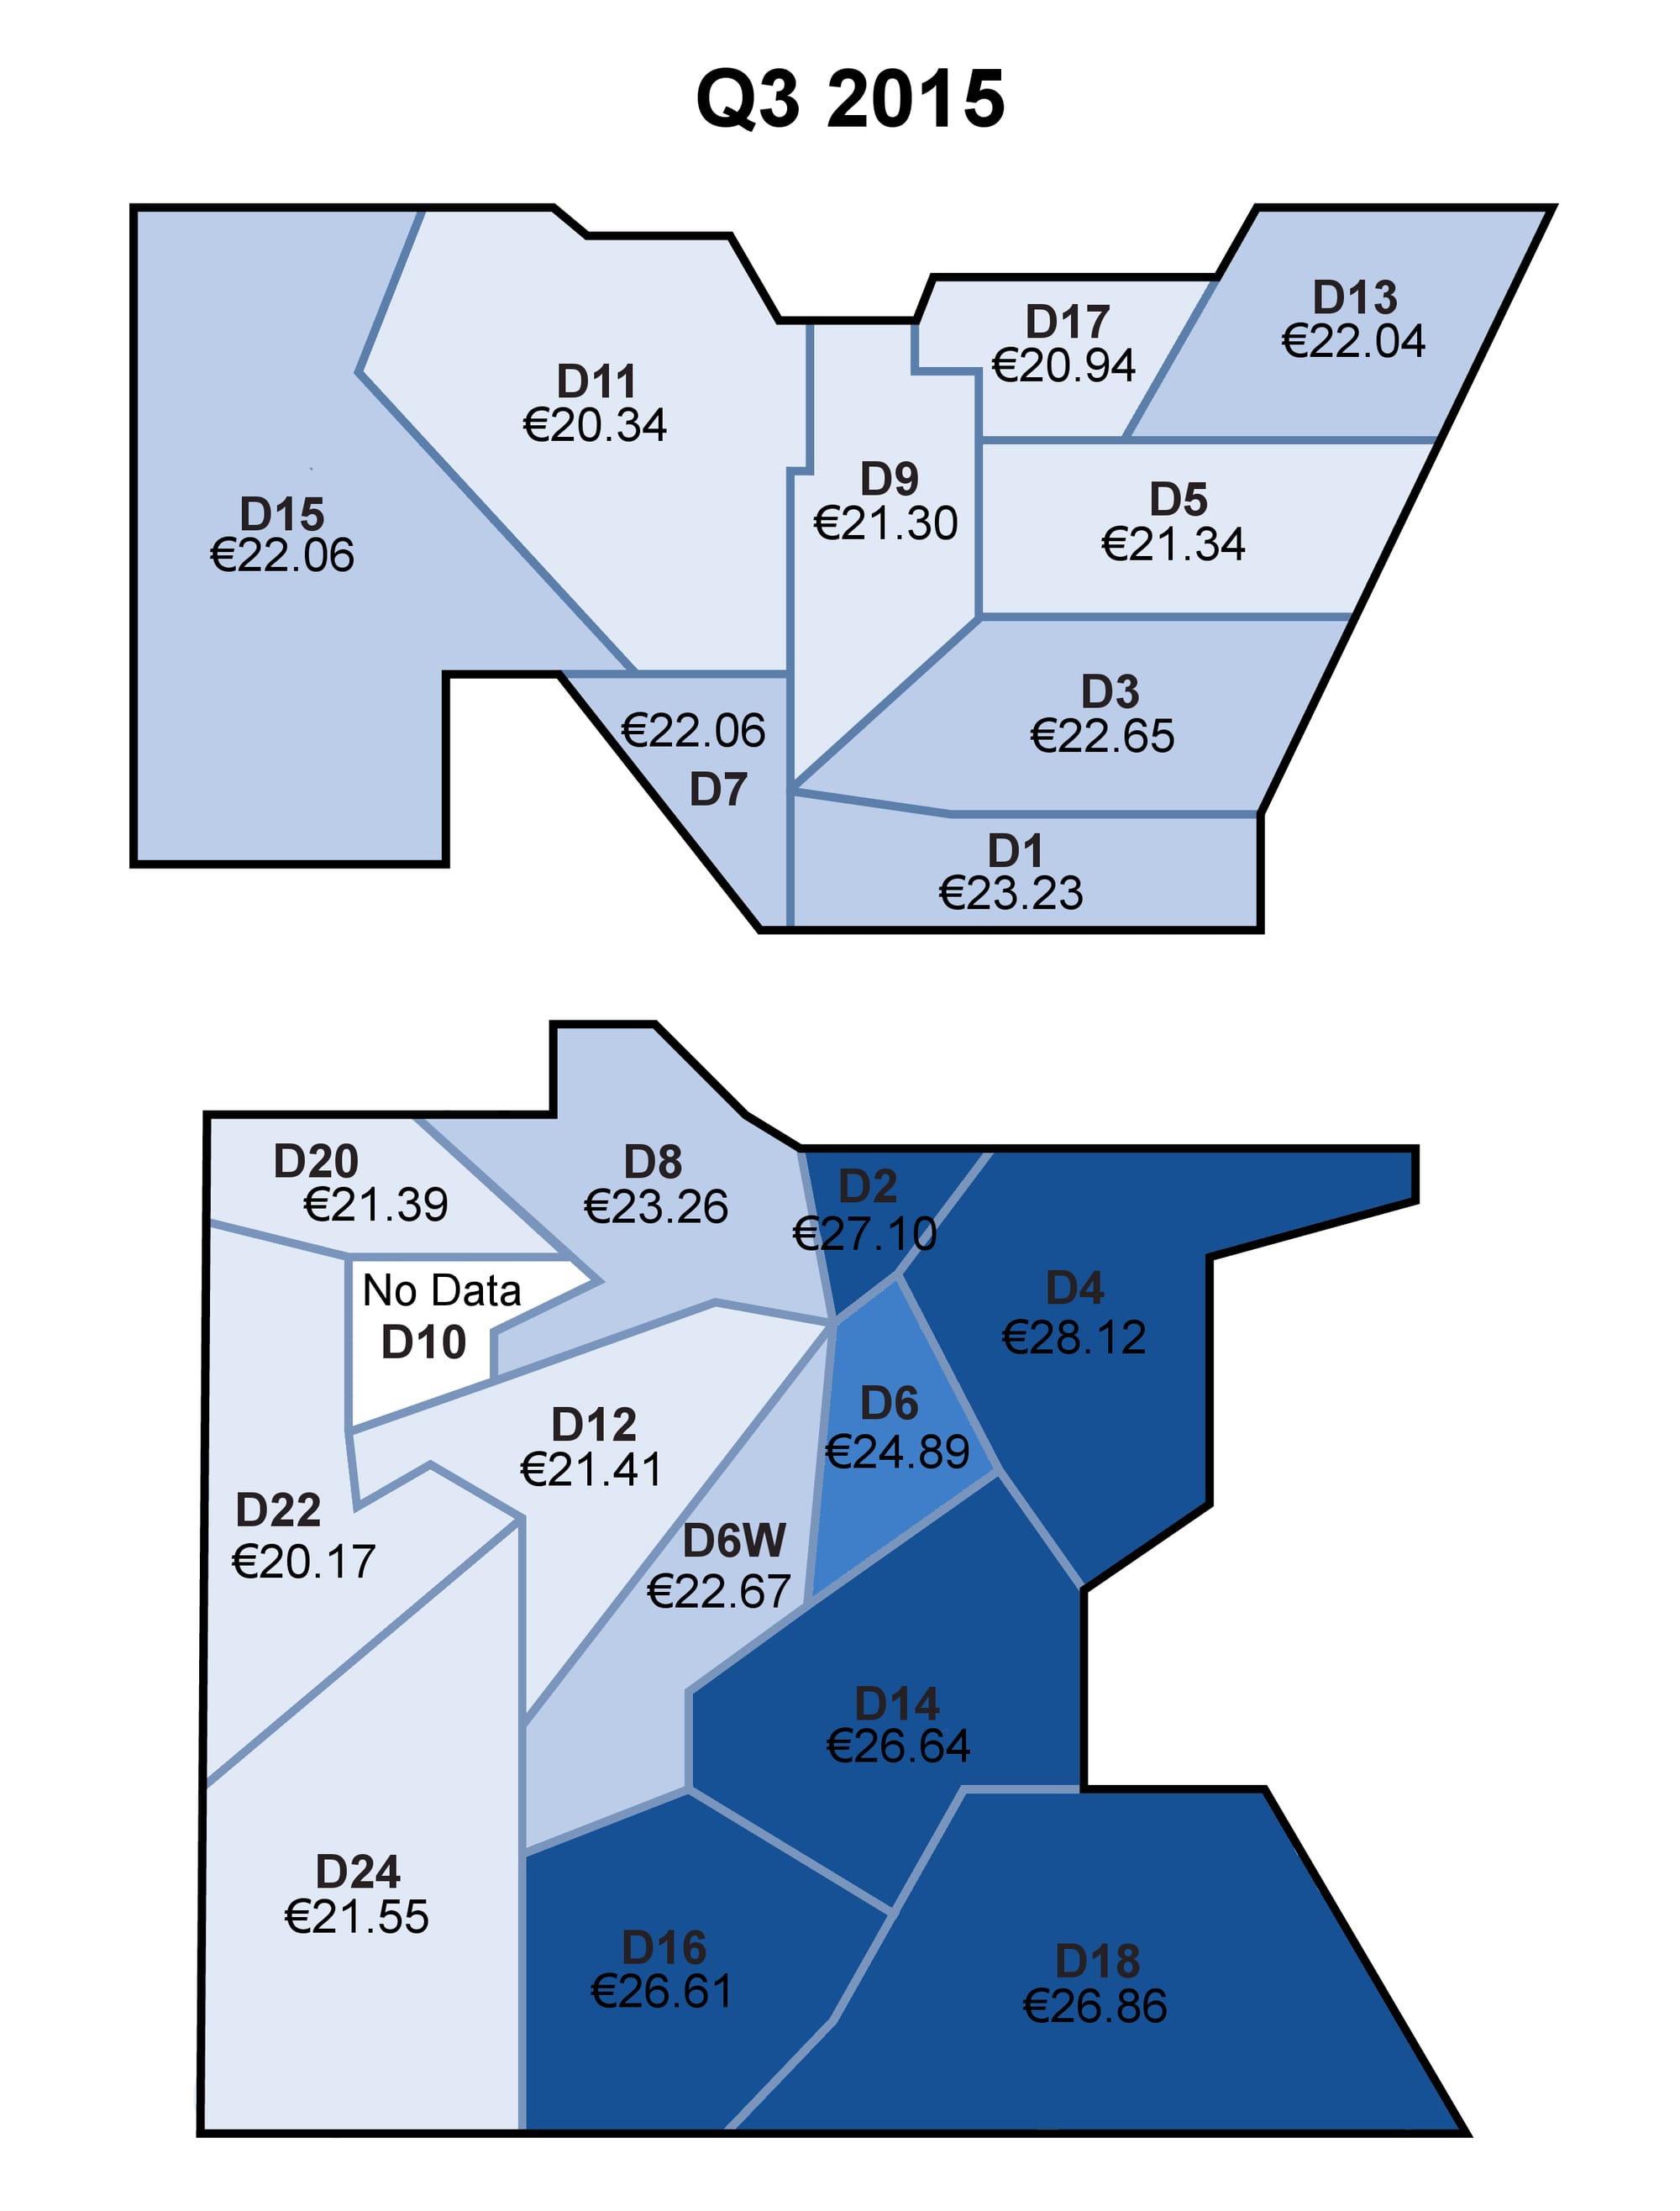
Back in the third quarter of 2015, you should have been earning €21.30 to live in D9 if you wanted to spend no more than the recommended 30 percent of your income on housing. By the fourth quarter of 2016, that had risen to €24.13.
If you weren’t earning that, but were earning the minimum wage at the time of €9.15 per hour, in Q3 2015 you’d have had to work 83 hours a week to afford a place. By Q4 2016, you’d have had to work 11 more hours a week to be able to afford the same place.
Don’t live in Dublin 9? Scroll down and check the maps below to see how things have changed in your area.
By “affordable” we mean the one-bedroom wouldn’t cost more than 30 percent of your pre-tax income.
To calculate that, we took figures from the Residential Tenancies Board’s (RTB’s) average rent dataset for the average rent in each postcode during the third quarter of 2015, and the fourth quarter of 2016.
Then we did the maths, based on the assumption that people work 35.7 hours a week, which was the average usual hours according to data from the Central Statistics Office.
For D10, the figures weren’t available, and D22 is only for Clondalkin. We used an original base map from Stabilo Boss under CC BY-SA 3.0 license, which Karen Vaughan touched up for us. Then, this year, I updated the numbers.
When started on this update, we found the RTB had gone back and changed the data we’d based last year’s maps on.
That’s because of “Retrospective registrations i.e. landlords who register tenancies (subject to a late fee penalty) which commenced back in Q. 3 2015” and “Outliers i.e. these are extreme rent values which are identified and removed”, according to spokesperson Michelle Tritschler.
We’ve used the RTB’s updated figures for the Q3 2015 in the maps below, so they won’t match our previous maps for the same time period.
The two maps below show how much you should have been earning per hour in the third quarter of 2015 to afford a one-bedroom apartment in each postcode, and what that figure was in the fourth quarter of 2016.

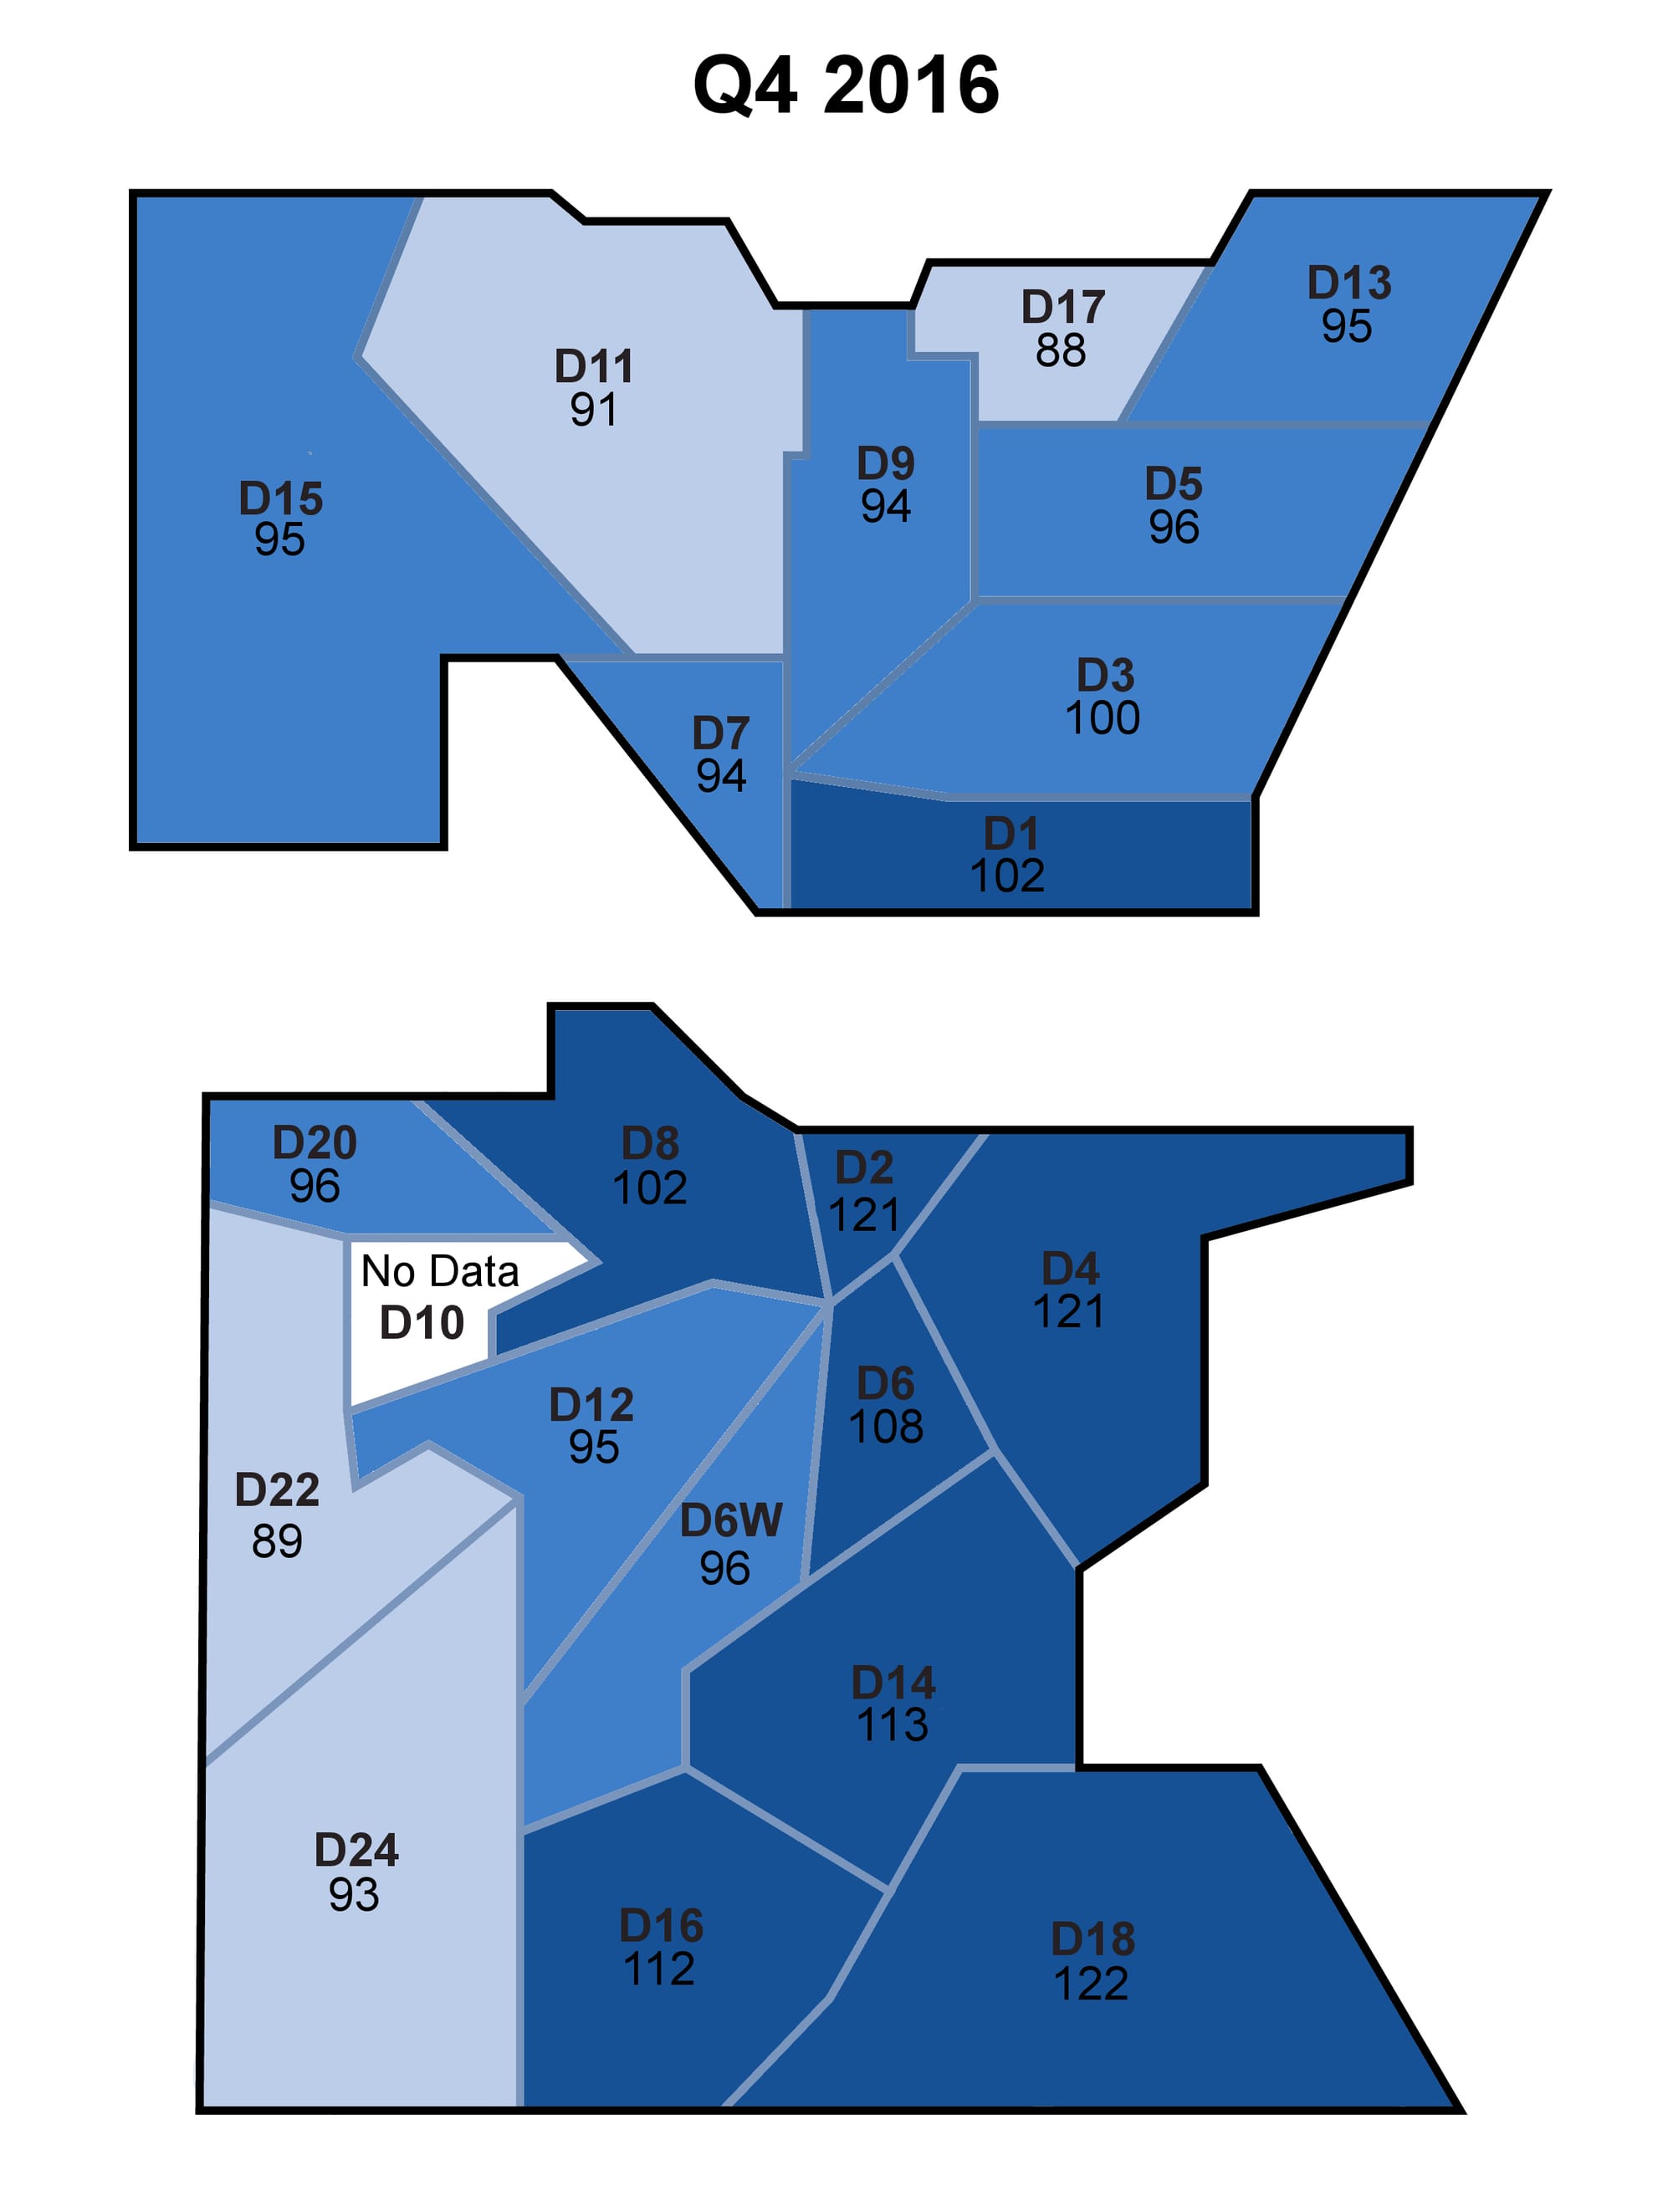
To show how out-of-reach renting a one-bedroom apartment is for many Dubliners, the next map shows how many hours you’d have to work on minimum wage to be able to afford one.
Minimum wage was €9.15 per hour during the two periods in question (it increased this year to €9.25). And we’re still sticking with the 30-percent-on-rent guideline.
In the most expensive postcode in the city in Q3 2015, which was Dublin 4, you would have had to work 110 hours a week. By Q4 2016, it would have been 121 hours a week.
But by Q4 2016, Dublin 4 was no longer them most expensive neighbourhood in the city to rent the average one-bedroom apartment, according to the RTB figures.
To rent a one-bedroom apartment in Dublin 2 had also climbed to 121 hours a week work. In Dublin 18, the figure had jumped to 122 hours.
The most affordable area in Q4 2016, meanwhile, was Dublin 17, where somebody on minimum wage would still have to work 88 hours a week to rent a one-bedroom apartment at only 30 percent of their income.
Prices have risen across the city, which means whether you’re earning €25 per hour or €9.25 an hour, more of your working hours are likely going to pay your rent.
The map below shows how many more hours a week you’d have had to work, earning the minimum wage, to be able to afford a one-bedroom apartment on 30 percent of your income in 2016, than in 2015.
For example, in Q3 2015, it would have cost €995 to rent the average one-bedroom in D1, so you should have been earning €3,317. By Q4 2016, it would have cost €1,125 for the apartment, so you should have been earning €3,749.
To make up that €432 difference, you’d have had to work 12 more hours a week at minimum wage, or 48 hours more per month.


The government should tell communities directly about plans for new asylum shelters, some activists and politicians say.


The current skirmish is over a Manna base at Junction 6 in Blanchardstown.

The idea is for this spot next to Dublin Castle to host choirs, chamber music, trad music, poetry performances, and more.