What’s the best way to tell area residents about plans for a new asylum shelter nearby?
The government should tell communities directly about plans for new asylum shelters, some activists and politicians say.
We’ve gotten used to the idea of data visualisations on a screen, says Mark Linnane. But that’s “kind of a limited way of thinking about space or a terrain”.

“Can you see me?” says Mark Linnane, over Zoom, as he walks around a plastic structure on the floor of an office at Maynooth University. “That gives you some sense of the size of it. It’s 3.5 metres by 2.”
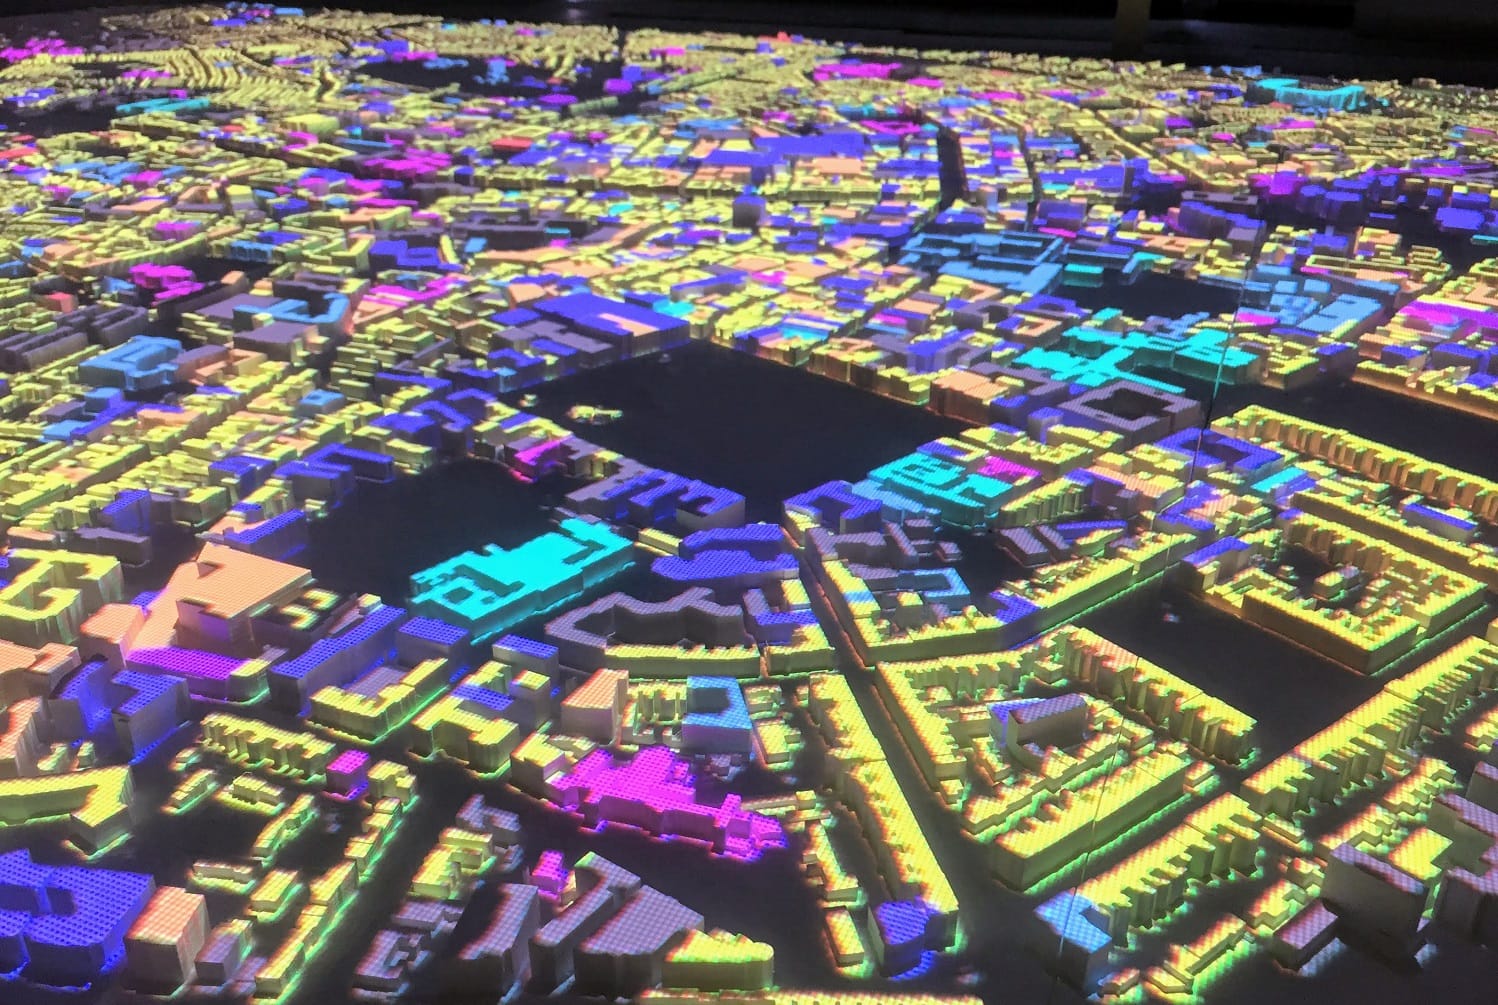
Linnane trails his laptop’s webcam over the surface of the off-white 3D model, giving a birds-eye view of tens of thousands of tiny buildings, the trails of roads and the clear pathway of the Liffey.
This replica of the heart of the city from Phoenix Park to Dublin Port was created to scale by the university’s Building City Dashboards team, using data from the Ordnance Survey Ireland.
In the five years since they started to grapple with the question of how to present data about the city in an engaging and accessible way, the team has experimented with virtual reality, and augmented reality – and most recently, with this new form of mapping, which blends the lego-like miniature of Dublin’s centre with changeable data projected on.
This could really come into its own as a public exhibit if they start to tell meaningful data-driven and empirical stories, says Linnane, a digital exhibition developer at Maynooth University.
Stories that are “relevant in terms of the everyday daily lives of people who will be coming to see it”, he says.
Getting the projector that throws the visualisations onto the model to work right was Linnane’s job, he says.
He had to mesh the Ordnance Survey data with others that showed building heights for example. “Every single building down to the sheds in someone’s garden have a unique identifier,” says Linnane.
Projectors are built to project onto flat surfaces and not 3D models so that had to be finessed, too, he says. “Every step on the way was a new development. There wasn’t really a process there before.”
The printed 3D model shows 7km by 4km of Dublin and 122,355 structures, says Linnane. That includes bigger buildings but also small outbuildings, railway platforms, public toilets and glasshouses – all mocked up and serving as a canvas for a kaleidoscope of data.
“We’re just projecting data on to it and seeing what’s going on with that,” says Rob Kitchin, principal investigator at Maynooth University’s Programmable City project.
That might mean data on air quality and CO2 emissions. It could mean showing the effects of flooding, too.
Linnane points to data on AirBnb properties and building use that they already have. “I think already there you have some of the ingredients of a data story let’s say around the housing crisis, or parts of it.”
A video of the model shows Luas trams snaking along the route of the red line from the south west of the city to the Docklands, as buildings light up in purples, yellows and red reflecting their uses.
It’s not just straight-forward illustrations of urban change that the model can host, though.
Jeneen Naji, a lecturer in digital media at Maynooth University with a keen interest in digital poetry, is interested in the idea of mirror worlds, she says.
“The idea is that the cities we inhabit day to day are analogue cities but in fact there also exists now these mirror worlds that are digital versions of the city we live in that are just as real,” says Naji.
Sensors all over the city gather data which is being fed back to influence governance, she says.
“It’s invisible to most of us but it’s still very real and still very impactful even down to the level of say waiting for a bus and how many minutes until the next bus comes,” says Naji.
Naji says she pondered ways to explore how to make the model more approachable while also making the algorithmic processes that compute large data collections in the city visible.
She came up with The River Poem, the idea of creating digital poetry to lure a larger audience into the often complex world of data, says Naji.
She took James Joyce’s Finnegans Wake, and fed the novel’s text into an algorithm which spat out other text, written in a similar style, says Naji.
She and her colleague Pauric Freeman picked out snippets and phrases, plugged them into an Excel sheet, from where they were picked out randomly by another algorithm and mapped onto the Liffey on the 3D model. A video of the digital poem shows lines from the algorithm looping down the water way.
The algorithm makes us think about creative and authorial agency while the digital poem itself gives us an alternative way of viewing the city, says Naji.
“We do need to become more data literate and this is a way of making people more aware of that,” she says.
The Maynooth team hasn’t had much chance to show people the model, says Linnane.
But when they have, he gives people time to ground themselves in it, to find a focal point that they recognise and orient by, before triggering the data layers.
“When a person identifies a certain part of the model that really pins them down and it becomes more personal or something,” he says.
Says Kitchin: “It’s easier to place yourself in a 3D environment than it is to place yourself in a 2D environment and it’s much easier to see the building develop as a 3D object than a bunch of flat paper maps.”
People can interact with the 3D model, walk around it, point things out in a way that mightn’t happen with other forms of mapping, says Linnane.
“We’ve got very used to the idea of screen-based data visualisation or even looking at Google Maps on a screen which is kind of a limited way of thinking about space or a terrain,” says Linnane.
Building City Dashboards, says Kitchin, is linked into the open data movement, engaging on questions on how data is shared, and can be used to think about the city and put forward ideas.
“It’s also about providing data which other people can use as evidence in whichever argument they’re trying to make,” says Kitchin.
Linnane, the digital exhibition developer, says he wants to partner with all kinds of people to help them tell stories – community groups, history groups, school kids.
“If I could wave a magic wand and put this out in the world in any way that I’d like to – I would like to host different curatorships of the model and the system,” he says.

The government should tell communities directly about plans for new asylum shelters, some activists and politicians say.


The current skirmish is over a Manna base at Junction 6 in Blanchardstown.

The idea is for this spot next to Dublin Castle to host choirs, chamber music, trad music, poetry performances, and more.
Get our latest headlines in one of them, and recommendations for things to do in Dublin in the other.